Forans Trading Signals
1. Principles
Forans Trading Signals are generated by the system when a trading opportunity is detected in a Forans Live Forecast for a specific asset. These situations often correspond to the break of a support or a resistance but not only (see more below).
Server-side the Forans forecast charts are recalculated every few minutes for all assets involved: hundreds of currency pairs, indices and cryptos.
These forecasts are then analysed to determine if there is potential for a Trading Signal.
The Signal is then sent to your Android phone via a notification. By pressing on that notification you access to the Trading Signal Lit and then to the full Trading Signal information.
Each Signal indicates the expected market direction and, most importantly, the precise price target of that move (up to three successive target levels).
The complete Forans Forecast chart that generated the Signal is included.
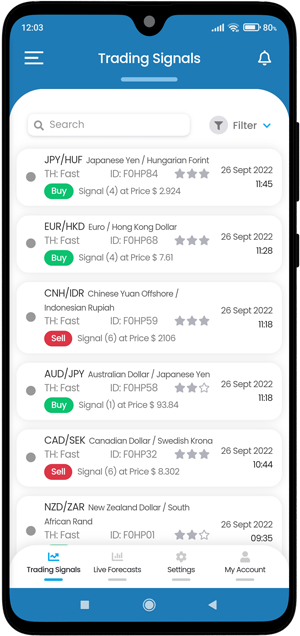
1.1. Trading Signals List
The trading signals cover a time horizon that varies from a few hours to a few weeks depending on the selected asset. A broad range of Markets is covered with more than 200 currency-pairs, world major indices, stocks as well as hundreds of cryptos.
Live forecast charts are also included, allowing near-real-time monitoring of an open position.
Whenever our servers generate a Trading Signal on any market you have subscribed to, you will receive a notification on the Forans app. By clicking the notification you are taken to the Trading Signals List. You can also acess it directly from the App main menu.
In the list the Trading Signals are shown chronologically, with the most recent on top.
Click on any Signal to access the full Trading Signal information.
The Filter function on the upper-right of the list allows to restrict the Trading Signals viewed by Market, Time Horizon or Type.
Note: Selection for the Rating (High, Medium, Low) of the Trading Signals received is to be found under the Settings tab.
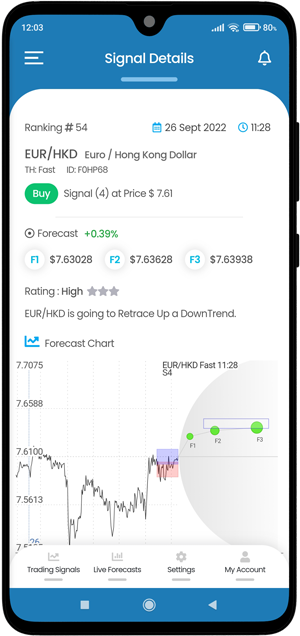
1.2. Trading Signals full information
From the Trading Signal list you can access the Trading Signal full information.
Asset name and ranking in the related market.
Date and time of the forecast generation.
Time Horizon of the forecast: fast, medium or slow
The Signal itself: Buy or Sell at <latest price available>
With the related price targets: F1, F2 and F3
The rating of the signal: 1 to 3 stars
(a rating for the model internally-valued prediction reliability)
The complete graph of the Forans model forecast that generated the Trading Signal.
Note that the technical indicators below the Forans chart can be activated or de-activated in the Settings tab.
1.3 Trading Signals categories in market context
Trading Signals are generated when the price moves forecast by the model corresponds to one of 4 categories of events in market context.
Signal(1) Break Above Resistance
This type of signal is generated when the asset price is hitting a strong resistance level.
On the Forans chart:
Forecast is Up.
In case of breaking of the resistance (shown as a purple rectangle), the empty rectangle indicates the target price of the possible Up movement. The red rectangle (not always present) indicates instead the Stop-order level.
Signal(9) Break Below Support
This type of signal is generated when the asset price is hitting a strong support level.
On the Forans chart:
Forecast is Down.
In case of breaking of the resistance (shown as a red rectangle), the empty rectangle indicates the target price of the possible Down movement. The purple rectangle (not always present) indicates instead the Stop-order level.
Signal(4) Retrace Up
This type of signal is generated when the asset price might retrace up after a recent downtrend.
On the Forans chart:
Forecast is Up.
The purple rectangle indicates the Resistance to be broken. The red rectangle indicates the Stop-order level. The empty rectangle indicates the target price of the possible Up movement.
Signal(6) Retrace Down
This type of signal indicates the situation in which the market after an uptrend is trying to retrace down.
On the Forans chart:
Forecast is Down.
The red rectangle indicates the Support to be broken. The purple rectangle indicates the Stop-order level. The empty rectangle indicates the Target price of the possible Down movement.